


Australia Wildfires


Australia Wildfires
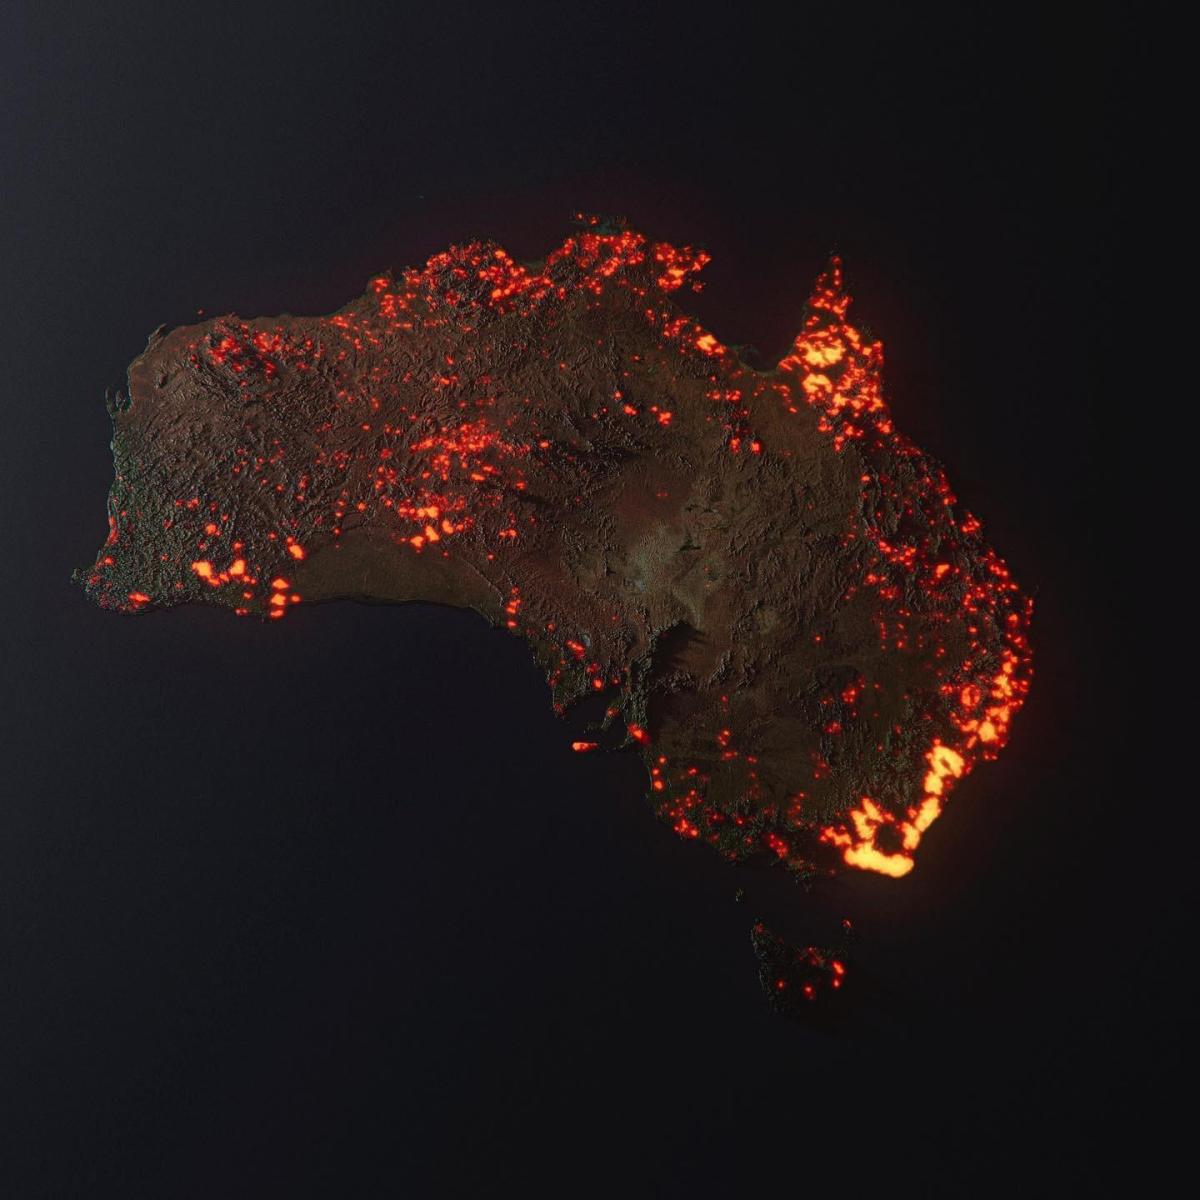
This report was to develop a way to display a month of Australia wildfire data, especially to contrast the Twitter flare that occurred with the following graphic. The project was to be done in base R - no ggplot.

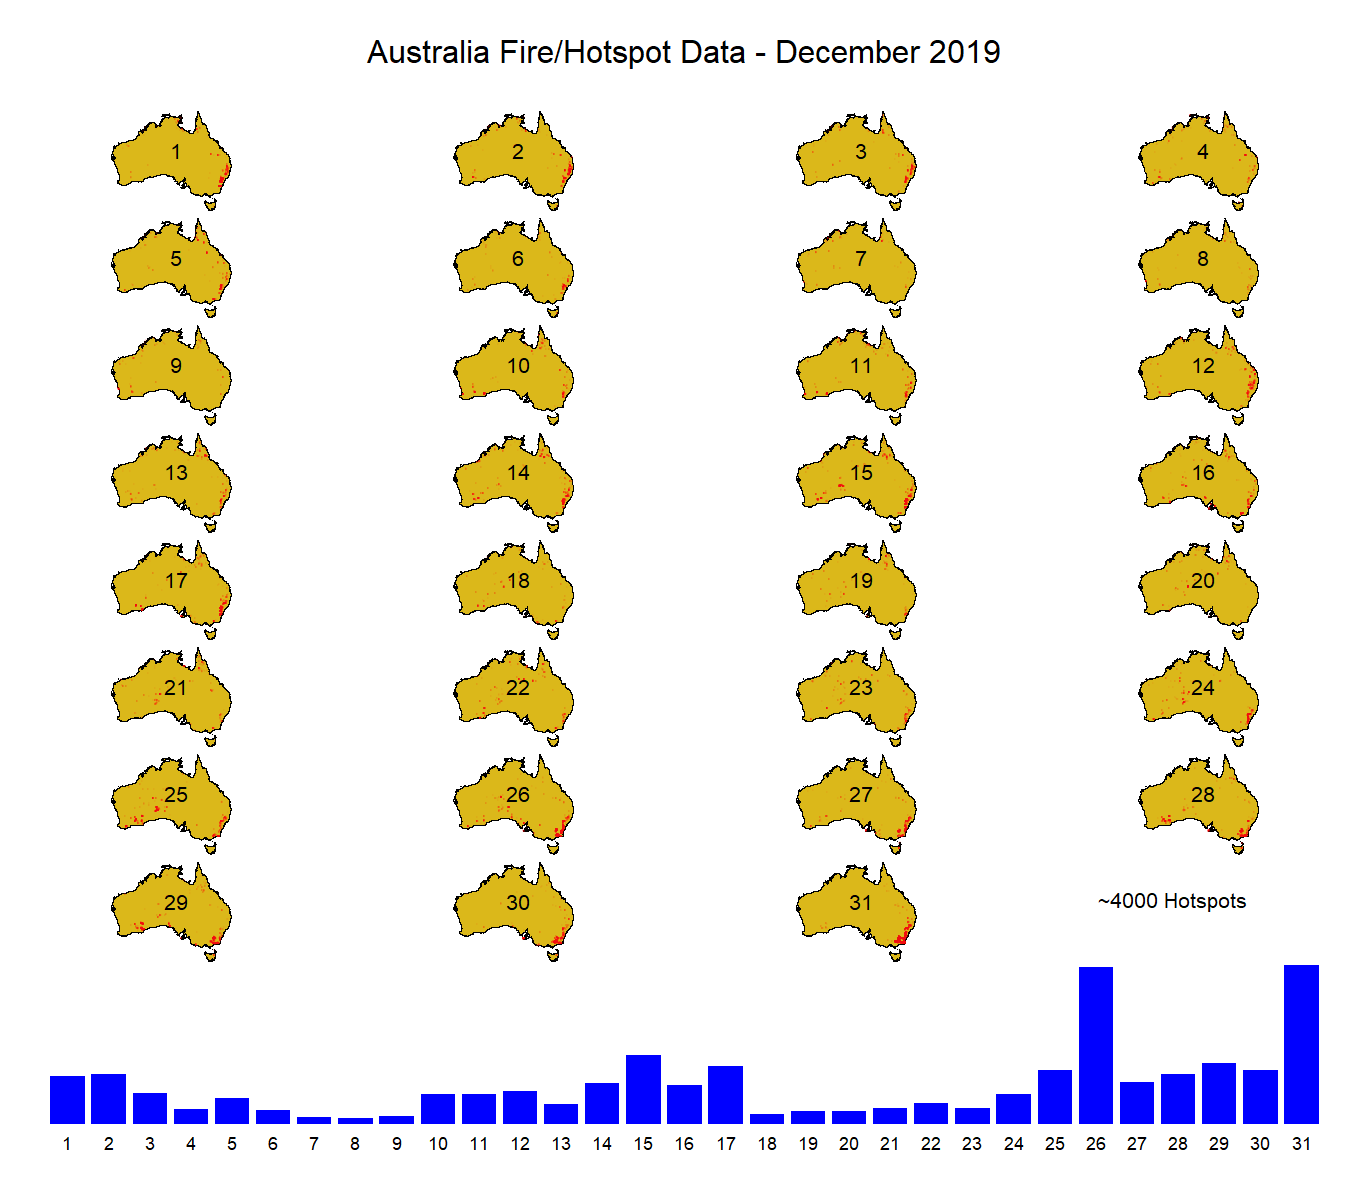
This visualisation attempts to describe one month of Australian wildfire data made available by the NASA Fire Information Management System. One of the goals of the project was to provide a more temporal, or chronological, presentation of the data. Since a dynamic presentation or animation was not permissible, another method to facilitate the presentation of chronological information needed to be developed. Small multiples seemed the obvious solution. It would enable the chronological presentation of the hotspot data. The visualisation is shown below:

Feedback
"The report presents an information-rich graphic with a series of small multiples indicating daily fire activity over geographical maps complemented with a bar chart of daily fire numbers. The design does a few things well by faceting the data into daily patterns and giving an overview as a complementary graphic. However, some limitations could have been addressed easily with some minor interventions. For instance, the numbers are plotted right over the maps and overlapping the maps themselves, moreover, you could have considered a more explicit naming for the labels, such as "December 1st" or so, to indicate that these are indeed dates clearly. Since you are also not giving us any information over the title or the footnotes, one is left a bit in the dark. You could have put a bit more effort in putting this graphic better in context and build some synergies within the components. They could speak a similar visual language, for instance, some annotation to the peaks in the bars and the maps could have worked well. Also, there is a note on your graphic that states "~4000 points" -- unclear what this represents?"